
EMDAD HAQUE
I am a seasoned IT Systems Engineer and Solution Architect specializing in systems design & administration,
virtualisation, networking, code development and automation for on-prem and Azure / AWS cloud infrastructure.
View a list of my projects
View my certifications on Credly
View my career history on LinkedIn
Download my Résumé: pdf -- doc
Monitor a Service on an Azure Windows VM and Create an Alert Notification if the Windows Service is not Running
Date: 04 Feb 2025
Scenario: A critical Windows service runinng on an Azure VM crashes and needs to be manually restarted due to some manual authentication steps required by the service.
Requirement: The IT team needs to be alerted when the Windows service is not running so that remediation efforts can be made as soon as it occurs.
Summary:
It is possible to create Alerts in Azure based on performance metrics and Windows Event Logs. The Alert can be used to trigger a notification using an Action Group.
We can collect Event Logs from VMs using Data Collection Rules that employ Azure Monitoring Agent (AMA) installed on the VMs to send the logs to a Log Analytics WorkSpace. Then, we create an Alert based on a Custom Log Search query which can trigger an alert notification to be sent.
In Windows Server OS, we can monitor events with the Event ID 7038 for services changing running state or Event ID 7000 if the service fails to start.However, Windows Client OSes (such as Windows 8, 10 or 11) do not trigger the 7038 events. To address this limitation, we can use a PowerShell script to monitor the Service state and log an event.
Steps:
- From Azure Portal, search for Log Analytics WorkSpace. Create a Log Analytics WorkSpace that will be the destination of the Windows event logs that will be collected from the Windows VM(s).
-
From Azure Portal, search for Data Collection Rule. Create a Data Collection Rule (DCR) using the settings mentioned below.
-
For the Platform Type, choose the Windows option.
-
For the Resources page, add the VM(s) you wish to monitor the service and collect the event logs from.
-
For the Data Sources page, click the + Add data source button and select Windows Event Logs from the drop-down. Then, select the Event Log Types and Log Level. You can choose from here as it suits you or use an XRPath filter under the Custom option.
I am choosing to collect only the Warning level events from the Application log as this is where our PowerShell script will log its findings.

-
For the Destination prompt, select Azure Monitor Logs for the Destination Type. Then, select the Log Analytics WorkSpace you created earlier and its correspong Subscription.
-
Creating the DCR will automatically prompt the Azure Monioring Agent (AMA) to be installed on the VMs specified under Resources using VM Extensions.
-
To verify that the Monitoring Agent is operating correctly, go to your “Log Analytics WorkSpace” from the Azure Portal and select Logs and run the KQL query below.
  Heartbeat
  | where TimeGenerated > ago(24h)
  | where Computer has "<<Your-Computer-Name>>"
  | project TimeGenerated, Computer, Category, Version
  | order by TimeGenerated desc
You should be able to see Heartbeat events being collected from the AMA.
-
To verify that the Event Logs are being collected, replace the above query with the query below and run it.
  Event
  | where Computer has "<<Your-Computer-Name>>"
  | where TimeGenerated > ago(48h)
  | order by TimeGenerated desc
You should be able to see events for the Event Log type and level you selected for the DCR.
-
- On the VM(s), I have used Task Scheduler and created a task that runs every 5 mins to trigger a PowerShell script (code provided below).
-
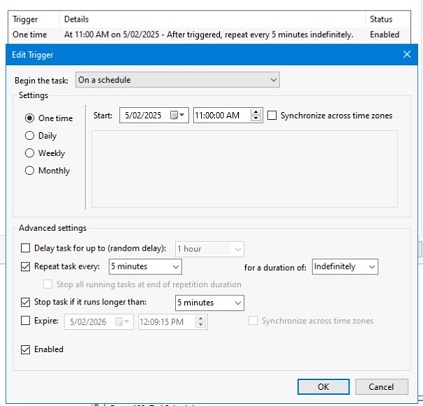
For the Trigger, choose On a schedule and One time under settings provided the start time.
Under Advanced settings check the option to Repeat task every 5 minutes for a duration of Indefinitely
-
For the Action, choose Start a program. For Program/Script, type powershell.exe and for Arguments type -File “C:\path\to\PS-script.ps1”
-
-
The PowerShell script checks if the specified service is running, and if not it logs a “Warning” level event in the Windows Application event log.
The PS v5.1 script is shown below. As an example, this is monitoring the Print Spooler service status.
# Define the service name you want to monitor $serviceName = "Spooler" # Display Name = Print Spooler # Define the event log source and log name $logSource = "ServiceMonitor" $logName = "Application" # Check if the event log source exists, if not, create it if (-Not [System.Diagnostics.EventLog]::SourceExists($logSource)) { New-EventLog -LogName $logName -Source $logSource } Try { # Get the service object $service = Get-Service -Name $serviceName # Check the status of the service if ($service.Status -eq 'Running') { # Only used for testing, no need to log event when service is running normally # Write-EventLog -LogName $logName -Source $logSource -EntryType Information -EventId 1000 -Message "The service '$serviceName' is currently running." } else { # When service is not running, log a Warning event Write-EventLog -LogName $logName -Source $logSource -EntryType Warning -EventId 1001 -Message "The service '$serviceName' is not running. Current status: $($service.Status)." } } Catch { # When service is not running or unknown state, log a Warning event Write-EventLog -LogName $logName -Source $logSource -EntryType Error -EventId 1002 -Message "Failed to retrieve the status of the service '$serviceName'. Error: $_" }-
To verify if the script is working, open Services.msc on the VM and stop the service you are monitoring such as the Print Spooler service.
Next, run the script manually or trigger it from the Task Scheduler and then open the Event Viewer > Application log and verify if the service is logging a Warning event.
-
-
Finally, from Azure Portal, search for Alerts and create an Alert Rule.
-
For the Scope page, select the VM(s) you are monitoring.
-
For the Condition page, select Custom log search option for the Signal Name and add the query below:
  Event
  | where Computer has "<<your-computer-name>>"
  | where Source has "ServiceMonitor"
  | where EventLevel == 3
  | where EventID == 1001 or EventID == 1002
  | where TimeGenerated > ago(15m)
  | order by TimeGenerated desc
Under Measurement, enter:
Mesure = Table Rows,
Aggregation Type:Count
Aggregation granularity:15 minutes
Operator = Greater than or equal to
Threshold value = 2
Frequency of evaluation = 15 minutesThis will trigger the alert if 2 or more Warning events are registered in the previous 15-minute period.
-
For the Actions page, select an existing Action Group or create a new one to send the notification. For example, I chose to send an email to myself.
-
For the Details page, enter the Alert Severity, Name and other details to create the Alert Rule.
-
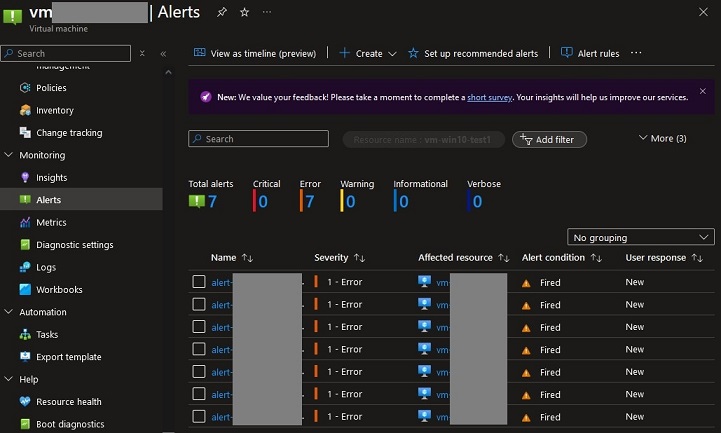
You should now start to receive an alert notification every 15 minute if the monitored service is not in a running state over 15 minutes.
Hope this was helpful.